Folder name is changed, rework the html templates
Change the organisation.
3.4 KiB
3.4 KiB
Ground Motion Measurements
Preprocessing of id31 ground motion measurement
data = table2array(readtable('./data/id31_camac_floor_PSD_october2014.txt'));The first column is the frequency vector in Hz.
gm.freqs = data(:, 1);The other colmns are the PSD of the ground velocity in $\frac{(\mu m/s)^2}{Hz}$ for the x,y,z axis. It is converted to $\frac{(m/s)^2}{Hz}$.
  gm.psd_vx = 1e-12*data(:, 2);
  gm.psd_vy = 1e-12*data(:, 3);
  gm.psd_vz = 1e-12*data(:, 4);
Finally, we integrate the signal to obtain the power spectral density of the ground displacement.
  gm.psd_dx = gm.psd_vx./(2*pi*gm.freqs);
  gm.psd_dy = gm.psd_vy./(2*pi*gm.freqs);
  gm.psd_dz = gm.psd_vz./(2*pi*gm.freqs);
The pre-processed data are saved.
save('./data/gm_esrf.mat', 'gm');Plots
We load measurements made:
- at ID31
- at ID09
- at CERN
  id31 = load('./data/ground_motion_psd.mat');
  id09 = load('./data/id09_floor_september2018.mat');
  cern = load('./data/ground_motion_dist.mat');
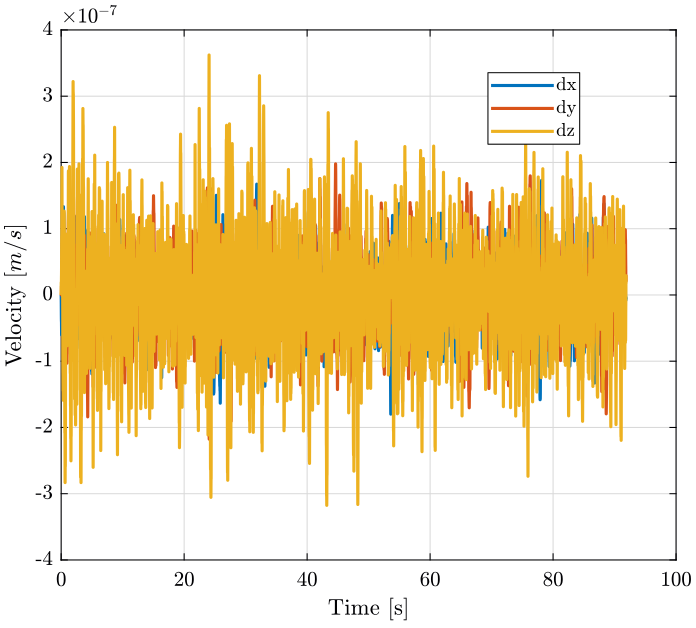
ID09 Measurements - Time Domain
  figure;
  hold on;
  plot(id09.time3, 1e-6*id09.x_y_z(:, 1), 'DisplayName', 'dx');
  plot(id09.time3, 1e-6*id09.x_y_z(:, 2), 'DisplayName', 'dy');
  plot(id09.time3, 1e-6*id09.x_y_z(:, 3), 'DisplayName', 'dz');
  hold off;
  xlabel('Time [s]'); ylabel('Velocity [$m/s$]');
legend(); <<plt-matlab>>
Compute PSD of ID09 ground motion
[id09_pxx, id09_f] = pwelch(1e-6*id09.x_y_z(:, 1), hanning(ceil(length(1e-6*id09.x_y_z(:, 1))/10)), 0, [], 1/(id09.time3(end)/(length(id09.time3) - 1)));Compare PSD of Cern, ID09 and ID31
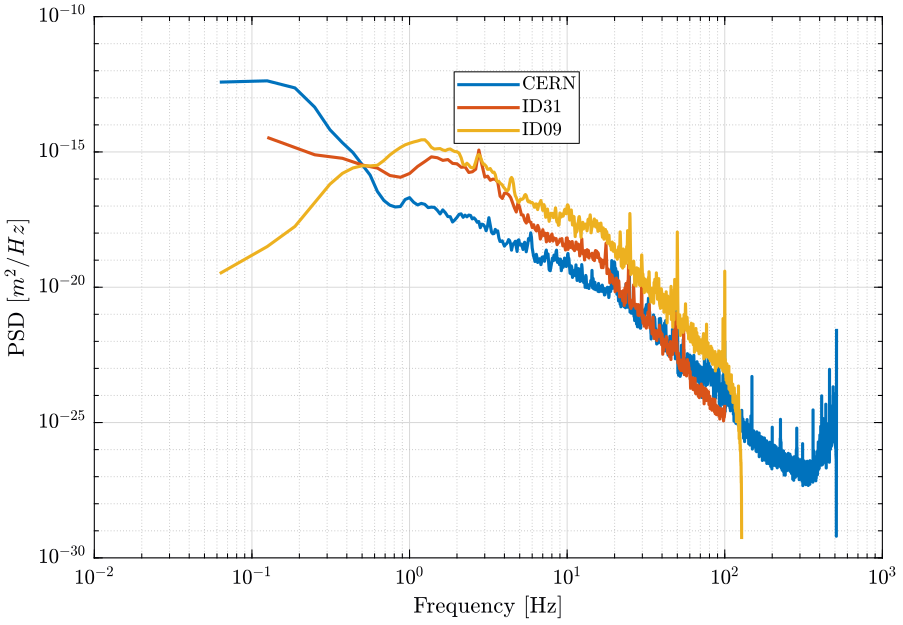
  figure;
  hold on;
  plot(cern.gm.freq, cern.gm.psd, 'DisplayName', 'CERN');
  plot(id31.freqs, id31.psd_dx, 'DisplayName', 'ID31');
  plot(id09_f, id09_pxx, 'DisplayName', 'ID09');
  hold off;
  set(gca, 'XScale', 'log'); set(gca, 'YScale', 'log');
  xlabel('Frequency [Hz]'); ylabel('PSD [$m^2/Hz$]');
legend('Location', 'northeast'); <<plt-matlab>>