Test Bench APA95ML
Table of Contents
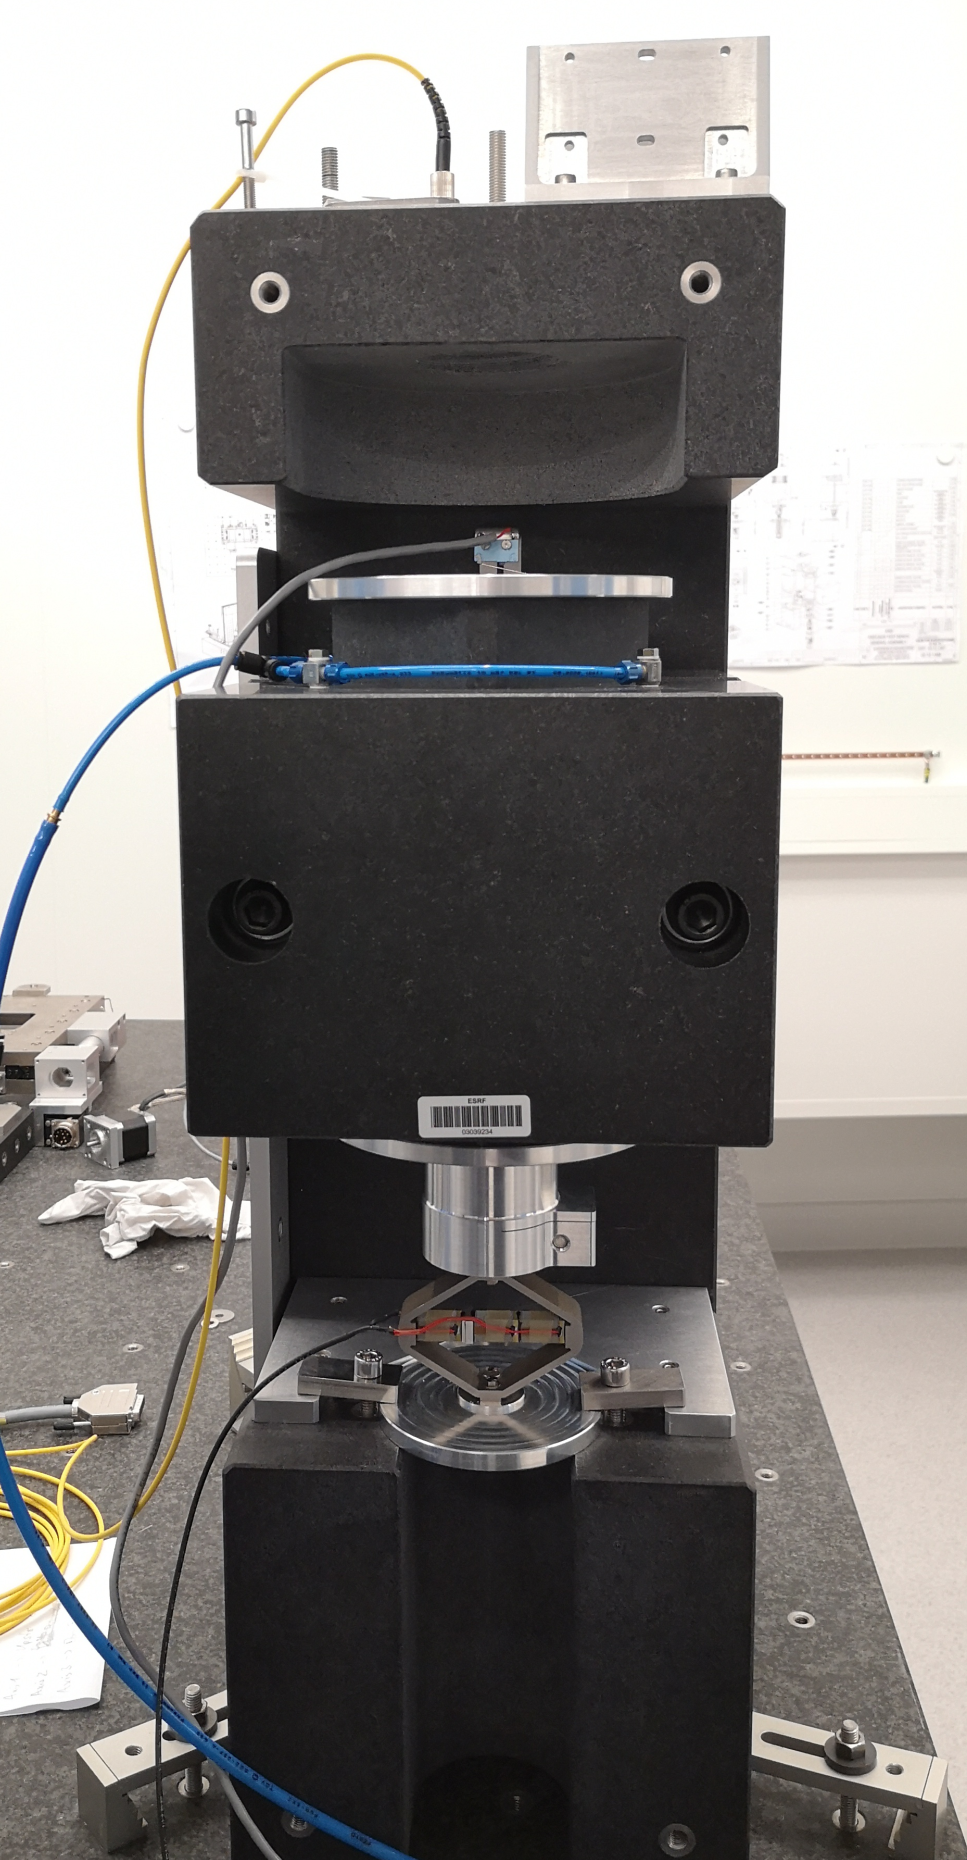
Figure 1: Picture of the Setup
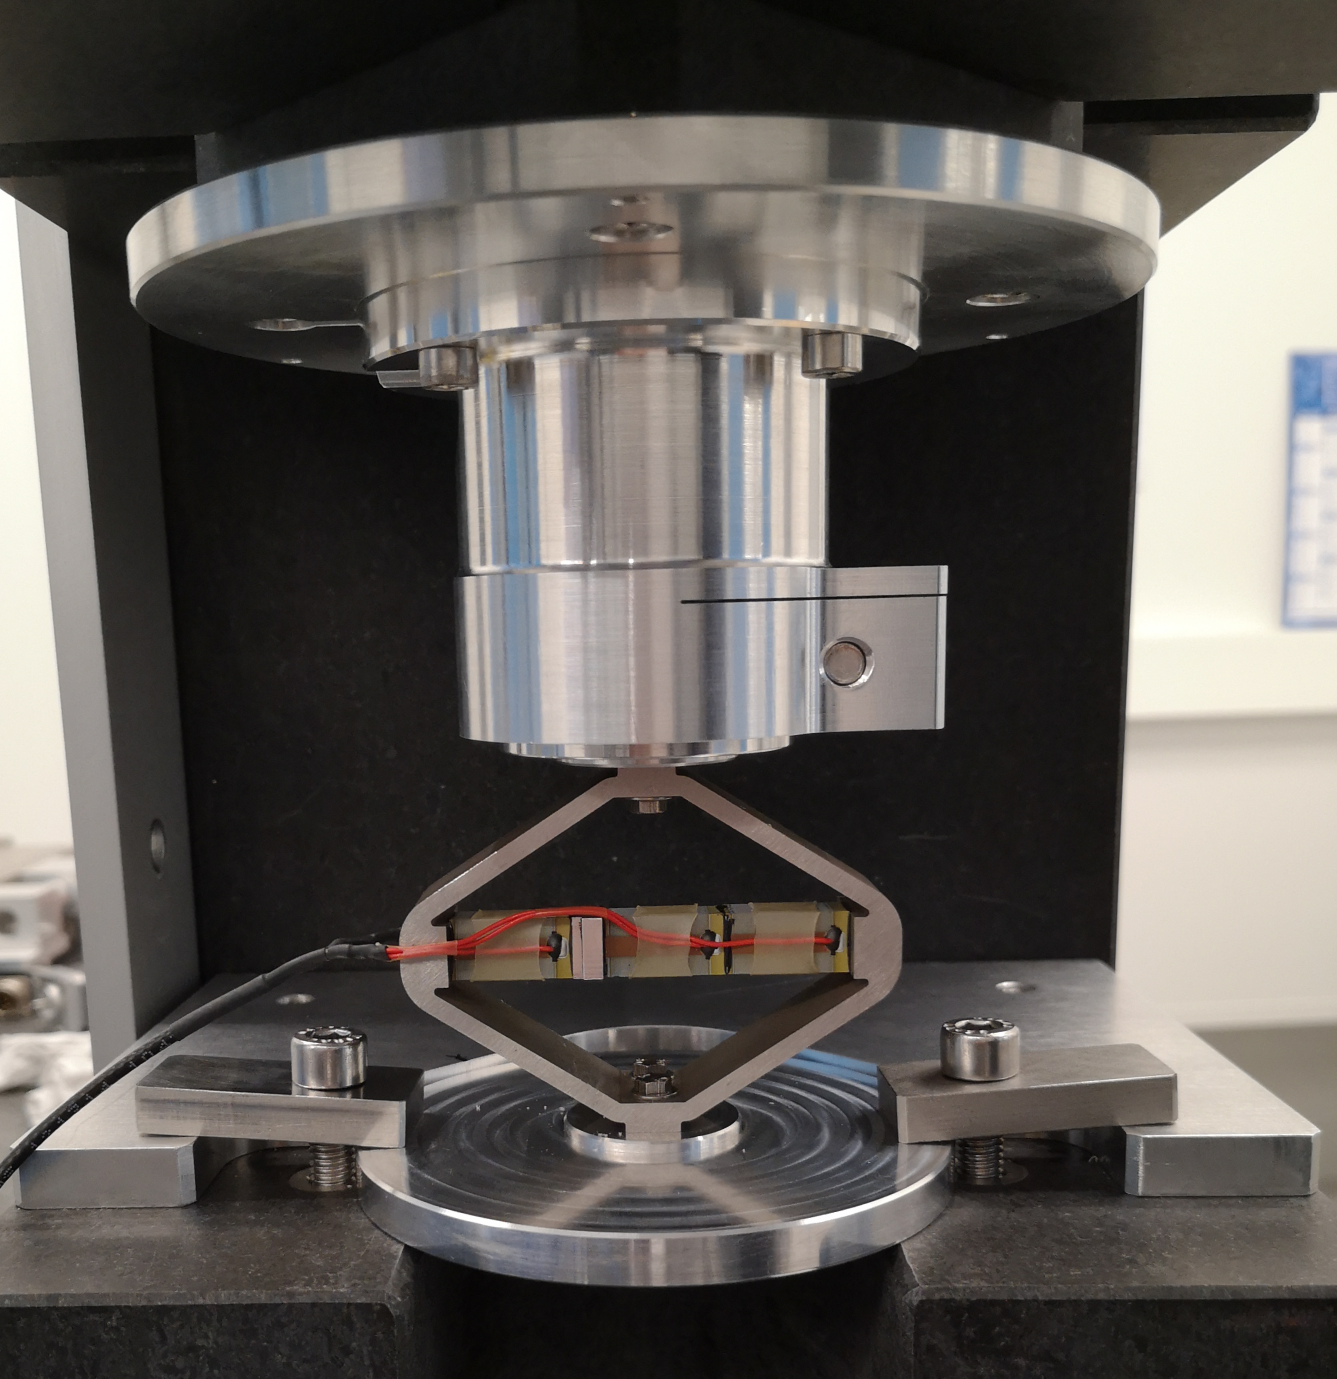
Figure 2: Zoom on the APA
1 Setup
1.1 Parameters
Ts = 1e-4;
1.2 Filter White Noise
Glpf = 1/(1 + s/2/pi/500);

Gz = c2d(Glpf, Ts, 'tustin');
2 Run Experiment and Save Data
2.1 Load Data
data = SimulinkRealTime.utils.getFileScopeData('data/apa95ml.dat').data;
2.2 Save Data
u = data(:, 1); % Input Voltage [V]
y = data(:, 2); % Output Displacement [m]
t = data(:, 3); % Time [s]
save('./mat/huddle_test.mat', 't', 'u', 'y', 'Glpf');
3 Huddle Test
3.1 Time Domain Data
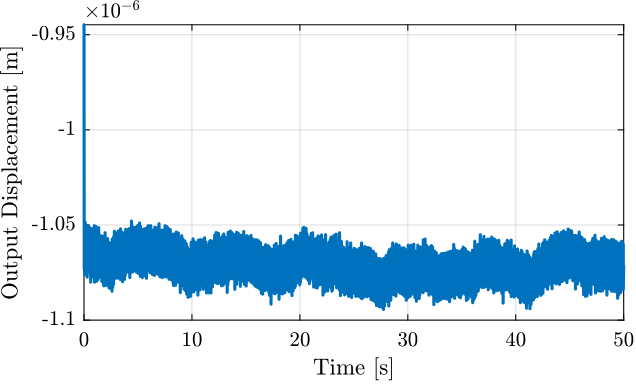
Figure 3: Measurement of the Mass displacement during Huddle Test
3.2 PSD of Measurement Noise
Ts = t(end)/(length(t)-1);
Fs = 1/Ts;

win = hanning(ceil(1*Fs));
[pxx, f] = pwelch(y, win, [], [], Fs);
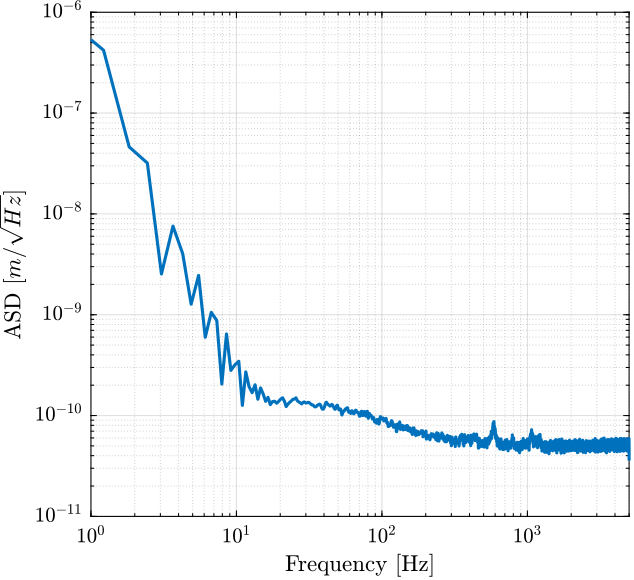
Figure 4: Amplitude Spectral Density of the Displacement during Huddle Test
4 Transfer Function Estimation with \(m=5kg\)
4.1 Time Domain Data
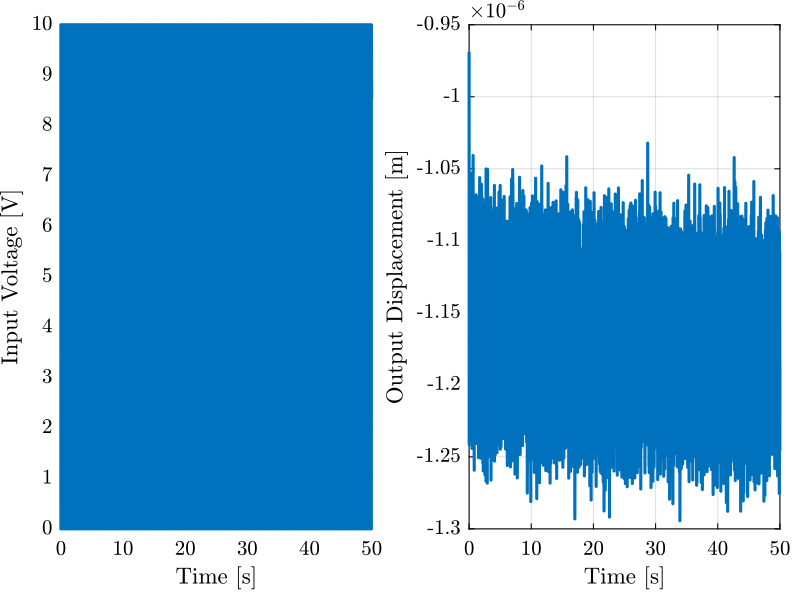
Figure 5: Time domain signals during the test
4.2 Comparison of the PSD with Huddle Test
Ts = t(end)/(length(t)-1);
Fs = 1/Ts;

win = hanning(ceil(1*Fs));
[pxx, f] = pwelch(y, win, [], [], Fs);
[pht, ~] = pwelch(ht.y, win, [], [], Fs);
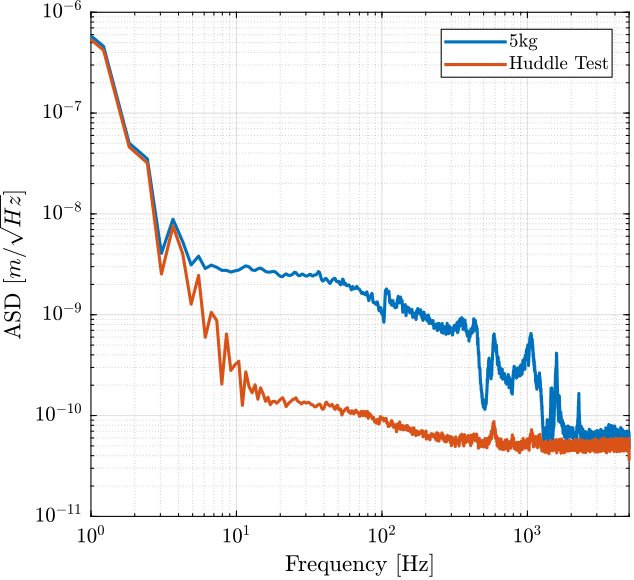
Figure 6: Comparison of the ASD for the identification test and the huddle test
4.3 Compute TF estimate and Coherence
win = hann(ceil(1/Ts));

[tf_est, f] = tfestimate(u, -y, win, [], [], 1/Ts);
[co_est, ~] = mscohere(  u, -y, win, [], [], 1/Ts);
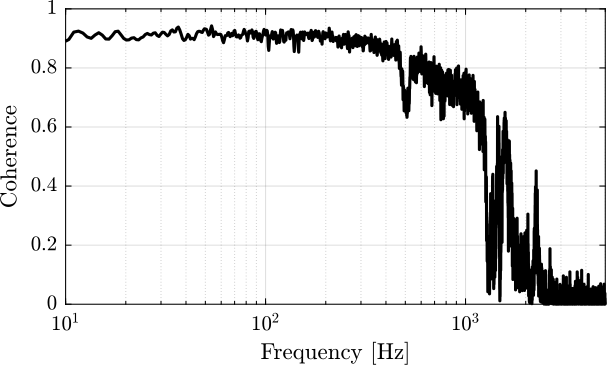
Figure 7: Coherence
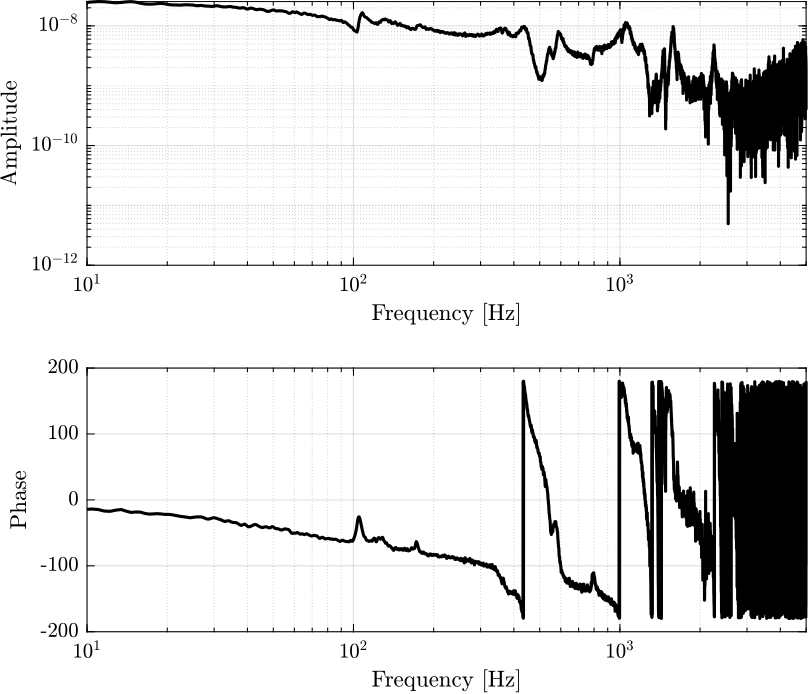
Figure 8: Estimation of the transfer function from input voltage to displacement
4.4 Comparison with the FEM model
load('mat/fem_model_5kg.mat', 'Ghm');
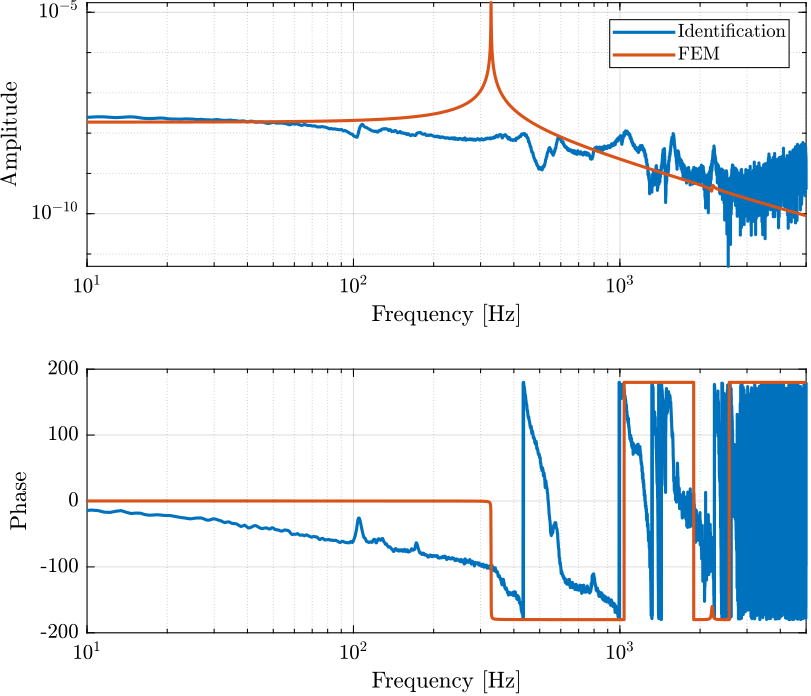
Figure 9: Comparison of the identified transfer function and the one estimated from the FE model