Equipment
Table of Contents
1 Sensors
1.1 Inertial Sensor
1.2 Force Sensors
| PCB | link |
1.3 Position Sensor

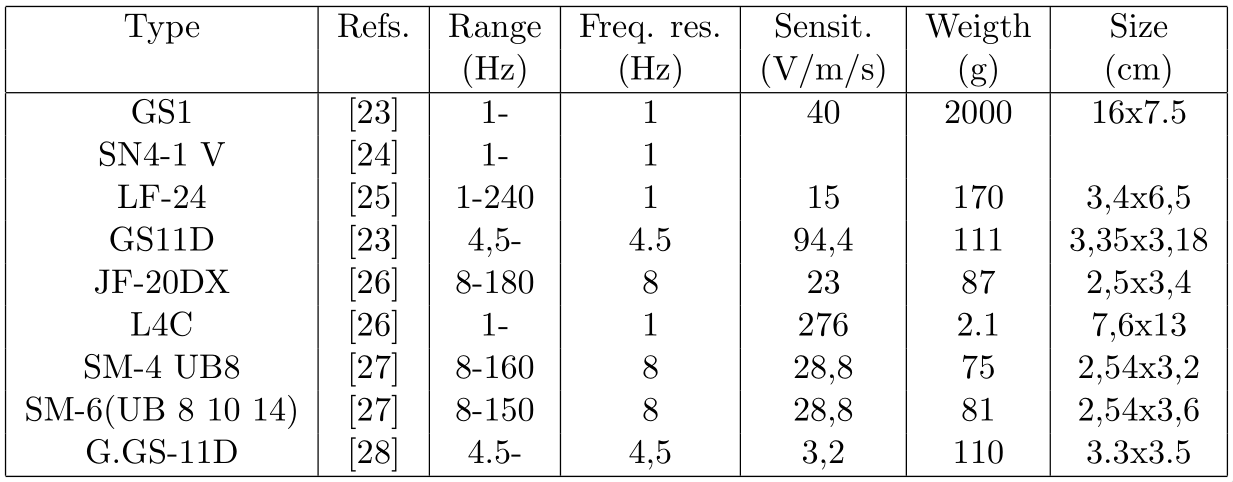
Figure 3: Characteristics of relative measurement sensors cite:collette11review

Figure 4: Position sensor characteristics cite:fleming13reviewnanomresolpositsensor
1.3.1 Strain Gauge
1.3.2 Capacitive Sensor
Description:
- http://www.lionprecision.com/tech-library/technotes/cap-0020-sensor-theory.html
- https://www.lionprecision.com/comparing-capacitive-and-eddy-current-sensors
| Micro Sense | link |
| Micro-Epsilon | link |
| PI | link |
| Unipulse | link |
| Lion-Precision | link |
1.3.5 Interferometers
| Attocube | link |
| Zygo | link |
| Smaract | link |
| Qutools | link |
| Renishaw | link |
| Sios | link |
| Keysight | link |
| Temperature (\(\pm\ ^oC\)) | Pressure (\(\pm\ hPa\)) | Humidity \(\pm\ \% RH\) | Wavelength Accuracy (\(\pm\ \text{ppm}\)) | |
|---|---|---|---|---|
| Attocube | 0.1 | 1 | 2 | 0.5 |
| Renishaw | 0.2 | 1 | 6 | 1 |
| Picoscale | 0.2 | 2 | 2 | 1 |
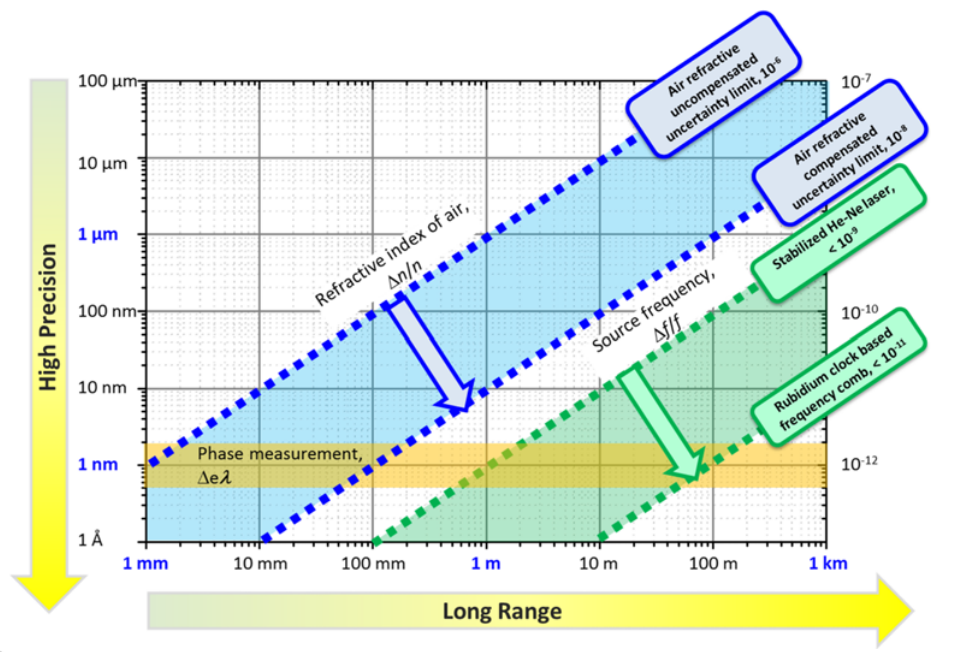
Figure 5: Expected precision of interferometer as a function of measured distance. Taken from cite:jang17compenrefracindexairlaser
1.3.6 Fiber Optic Displacement Sensor
| Unipulse | link |
1.4 Bibliography
cite:collette12compar cite:collette12review cite:fleming13reviewnanomresolpositsensor
2 Actuators
2.2 Voice Coil
2.4 Brushless DC Motor
cite:yedamale03brushdcbldcmotorfundam
3 Measurement System / Acquisition System
3.1 Modal Analysis
4 Control System
Dspace, Speedgoat
5 Positioning Stages
5.1 Hexapods
5.2 Translation/Rotation Stage
6 Amplifiers
6.1 Current Amplifiers
6.2 Voltage Amplifiers
7 ESRF Equipment
7.1 Geophones
7.1.1 L-28LB
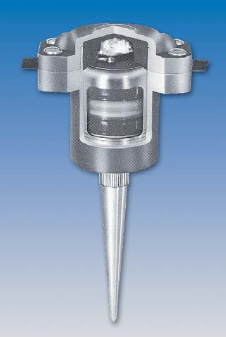
Figure 6: Picture of the L-28LB Geophone
| Natural Frequency [Hz] | 4.5 |
| Weight [g] | 140 |
| Sensitivity [V/(m/s)] | 31.3 |
We define the parameters of the geophone and we plot its bode plot (figure 7).
w0 = 4.5*2*pi; % [rad/s]
ksi = 0.38;
G0 = 31.3; % [V/(m/s)]
G = G0*(s/w0)^2/((s/w0)^2 + 2*ksi*(s/w0) + 1);
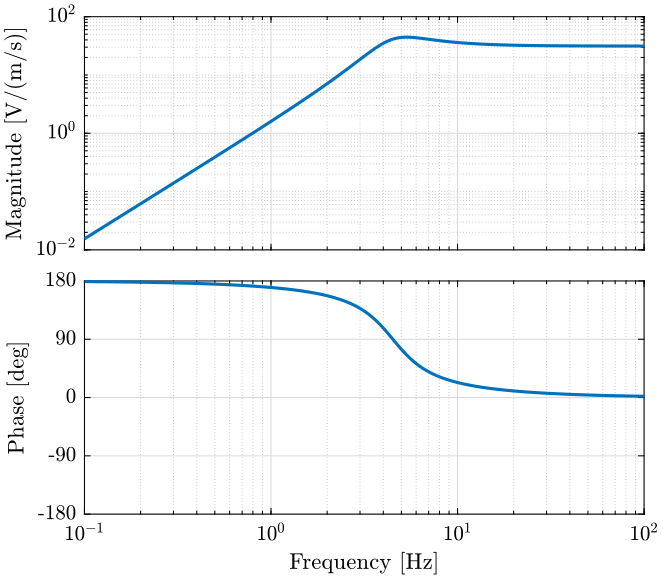
Figure 7: Bode plot of the L-28LB Geophone
7.1.2 L-4C
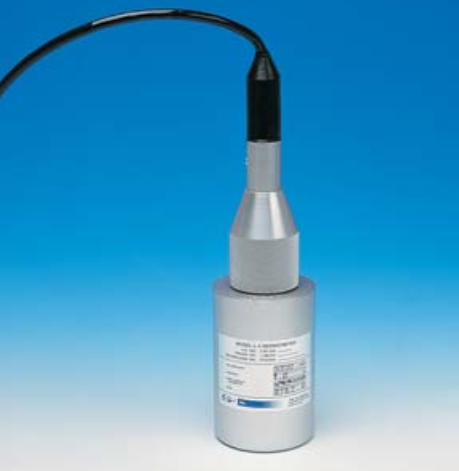
Figure 8: Picture of the L-4C Geophone
| Natural Frequency [Hz] | 1 |
| Weight [g] | 2150 |
| Sensitivity [V/(m/s)] | 276.8 |
The transfer function from the velocity and the measured voltage is defined below.
Its bode plot is shown on figure 9.
w0 = 2*pi; % [rad/s]
ksi = 0.28;
G0 = 276.8; % [V/(m/s)]
G = G0*(s/w0)^2/((s/w0)^2 + 2*ksi*(s/w0) + 1);
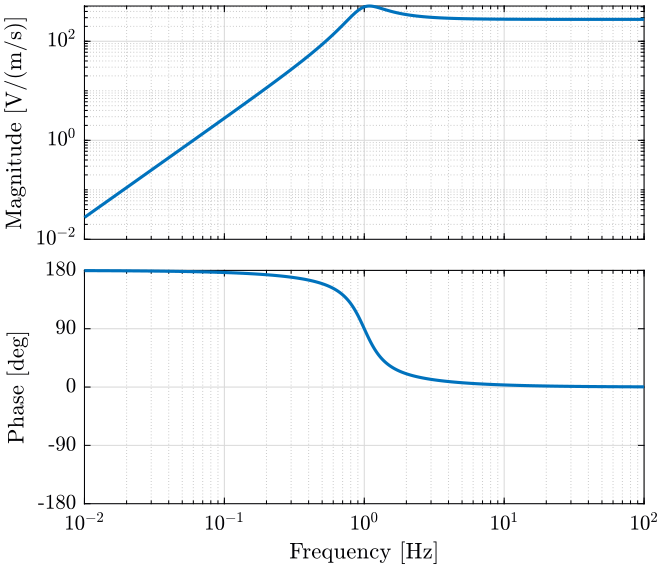
Figure 9: Bode plot of the L4C Geophone
7.2 Accelerometers
7.2.1 Pieozoelectric acc. 356b18 - 3 axis
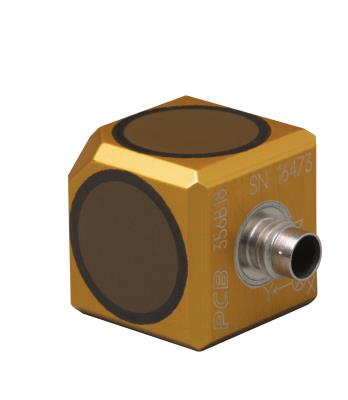
Figure 10: Pieozoelectric acc. 356b18 - 3 axis
| Sensitivity | 0.102 \(V/(m/s^2)\) |
| Measurement Range | 4.9 \(m/s^2\) pk |
| Frequency Range | 0.5 to 3000 Hz |
| resonant frequency | > 20000 hz |
| broadband resolution | 0.0005 \(m/s^2\) rms |
7.2.2 Ceramic acc. 393B05 - 1 axis
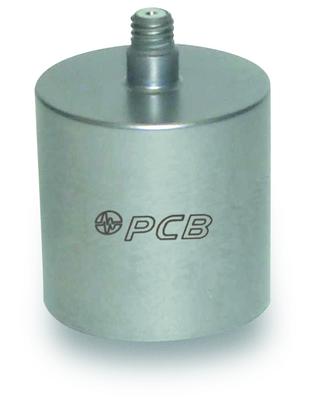
Figure 11: Ceramic acc. 393B05 - 1 axis
| Sensitivity (±10 %) | 1.02 \(V/(m/s^2)\) |
| Measurement Range | 4.9 \(m/s^2\) pk |
| Frequency Range (±5 %) | 0.7 to 450 Hz |
| resonant frequency | > 2500 hz |
| broadband resolution | 0.00004 \(m/s^2\) rms |

