Measurements
Table of Contents
1 Experimental conditions
| Date | 2017-11-17 |
| Sensors | Accelerometers |
| Excitation | Instrumented Hammer |
| Location | Laboratory |
Dynamics of the station is evaluated using instrumented hammer and accelerometers fixed on each stage.
Goal:
- Obtain a first estimation of resonance frequencies
- Measurement made in a metrology lab
- The granite is not glued to the floor
- The Y-Translation stage is powered and in closed-loop
- The spindle is not powered
- Mass is placed on top of the Hexapod (how much?) (figure 1).
- Made by Marc Lesourd on the 17th of November 2017
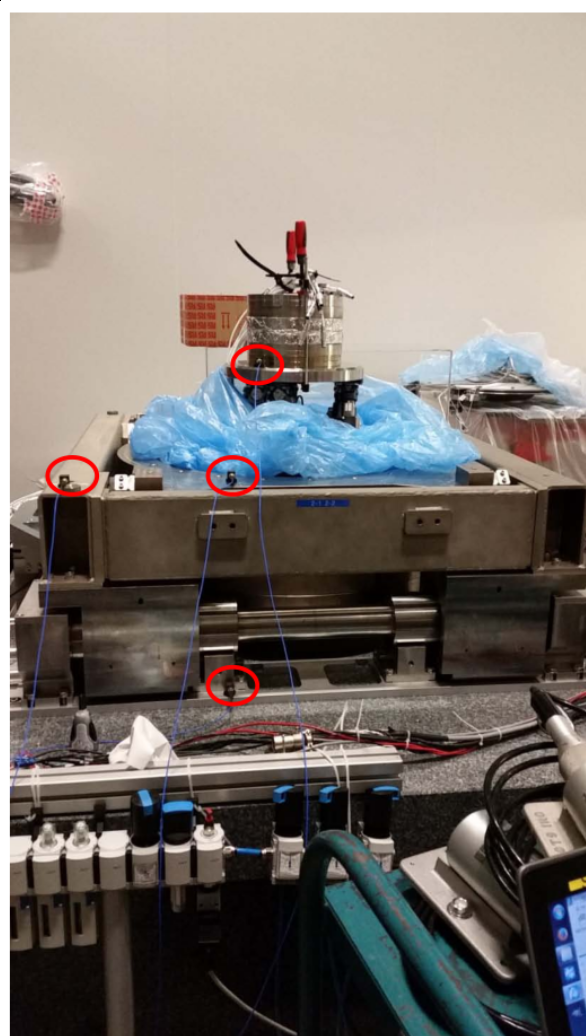
Figure 1: Accelerometers position
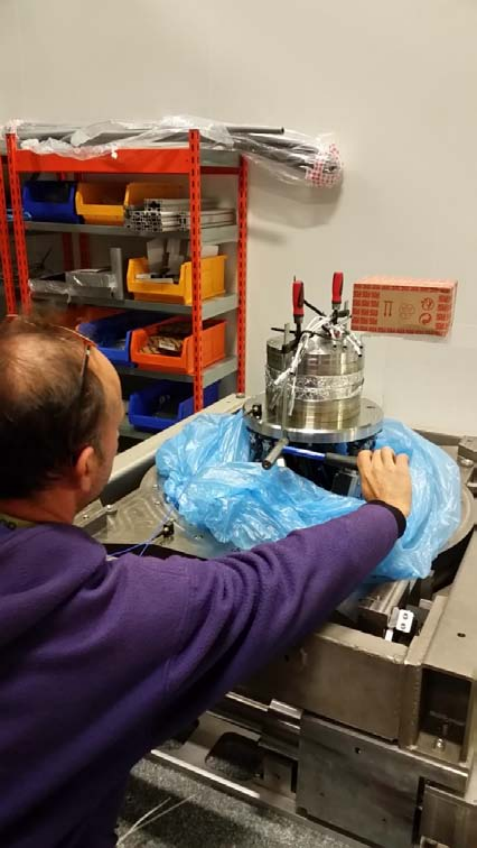
Figure 2: Instrumented Hammer used
2 Measurements procedure
3-axis Accelerometers (specifications table 1) are glued on (see figure 1):
- Marble
- Y-Translation stage
- Tilt stage
- top of Hexapod
| Sensitivity | 0.102 V/(m/s2) |
| Measurement Range | 4.9 m/s2 pk |
| Frequency Range | 0.5 to 3000 Hz |
| resonant frequency | >20000 Hz |
| broadband resolution | 0.0005 m/s2 rms |
The structure is excited using an instrumented hammer with impacts on (see figure 2):
- Marble
- Hexapod
3 Measurement Files
Two measurements files are:
id31_microstation_2017_11_17_frf.matthat contains:freq_frfthe frequency vector in Hz- Computed frequency response functions (see table 2)
id31_microstation_2017_11_17_coh.mat- Computed coherence
For each of the measurement, the measured channels are shown on table 3.
| Object name | Location | Direction |
|---|---|---|
| frf_hexa_x | Hexapod | X |
| frf_hexa_y | Hexapod | Y |
| frf_hexa_z | Hexapod | Z |
| frf_marble_x | Marble | X |
| frf_marble_y | Marble | Y |
| frf_marble_z | Marble | Z |
| Ch. nb | Element | Location | Direction |
|---|---|---|---|
| 1 | Not wired | na | na |
| 2 | Accelerometer | Marble | X |
| 3 | Accelerometer | Marble | Y |
| 4 | Accelerometer | Marble | Z |
| 5 | Accelerometer | Ty | X |
| 6 | Accelerometer | Ty | Y |
| 7 | Accelerometer | Ty | Z |
| 8 | Accelerometer | Tilt | X |
| 9 | Accelerometer | Tilt | Y |
| 10 | Accelerometer | Tilt | Z |
| 11 | Accelerometer | Hexapod | X |
| 12 | Accelerometer | Hexapod | Y |
| 13 | Accelerometer | Hexapod | Z |
4 Data Analysis
4.1 Loading of the data
load('./raw_data/id31_microstation_2017_11_17_coh.mat',...
     'coh_hexa_x',...
     'coh_hexa_y',...
     'coh_hexa_z',...
     'coh_marble_x',...
     'coh_marble_y',...
     'coh_marble_z');

load('./raw_data/id31_microstation_2017_11_17_frf.mat',...
     'freq_frf',...
     'frf_hexa_x',...
     'frf_hexa_y',...
     'frf_hexa_z',...
     'frf_marble_x',...
     'frf_marble_y',...
     'frf_marble_z');
4.2 Pre-processing of the data
The FRF data are scaled with the sensitivity of the accelerometer and integrated two times to have the displacement instead of the acceleration.
accel_sensitivity = 0.102; % [V/(m/s2)]
w = j*2*pi*freq_frf; % j.omega in [rad/s]

frf_hexa_x =  1/accel_sensitivity*frf_hexa_x./(w.^2);
frf_hexa_y = -1/accel_sensitivity*frf_hexa_y./(w.^2);
frf_hexa_z = -1/accel_sensitivity*frf_hexa_z./(w.^2);

frf_marble_x =  1/accel_sensitivity*frf_marble_x./(w.^2);
frf_marble_y =  1/accel_sensitivity*frf_marble_y./(w.^2);
frf_marble_z = -1/accel_sensitivity*frf_marble_z./(w.^2);
4.3 X-direction FRF
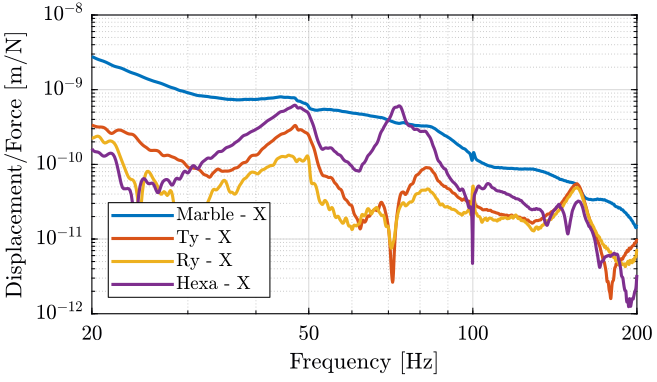
Figure 3: Response to a force applied on the marble in the X direction
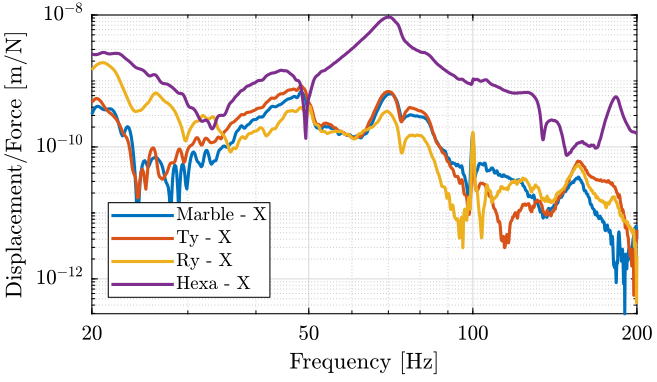
Figure 4: Response to a force applied on the hexa in the X direction
4.4 Y-direction FRF
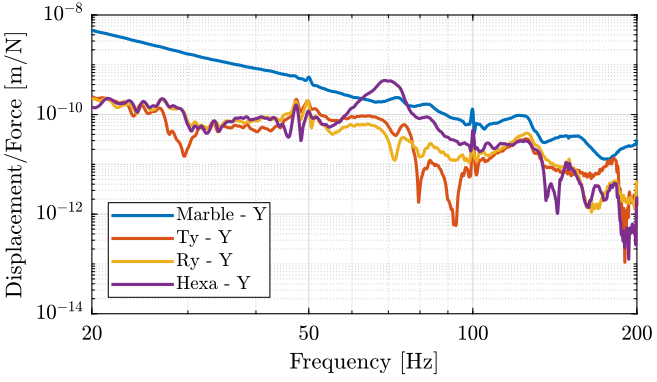
Figure 5: Response to a force applied on the marble in the Y direction
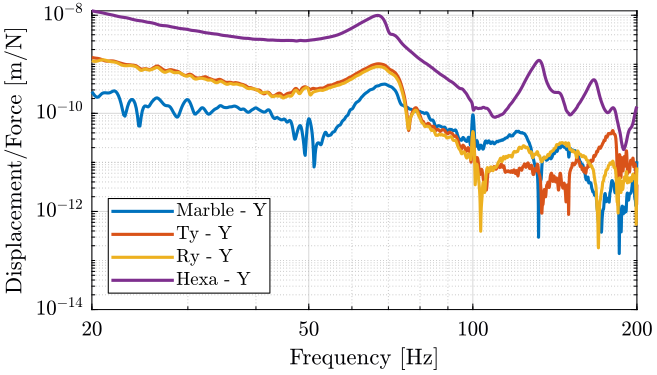
Figure 6: Response to a force applied on the hexa in the Y direction
4.5 Z-direction FRF
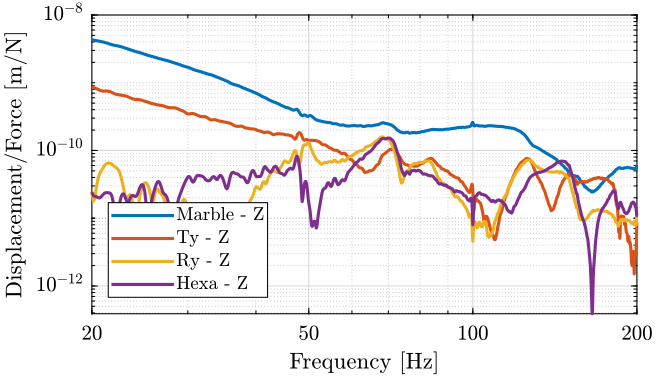
Figure 7: Response to a force applied on the marble in the Z direction
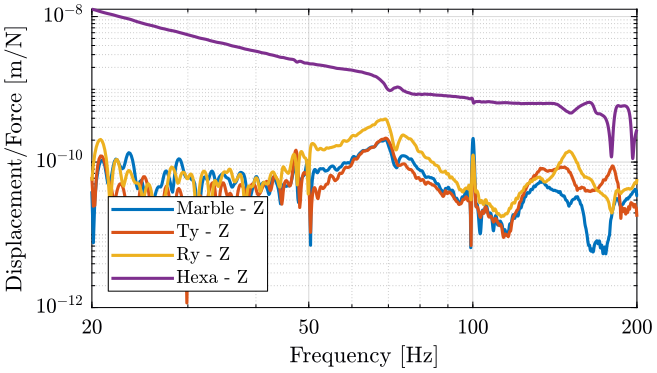
Figure 8: Response to a force applied on the hexa in the Z direction
5 Results
- Resonances have been identified at 45Hz and 75Hz
- However, the quality of the measurements are bad at low frequency
- New measurements should be done with Geophones