ESRF Double Crystal Monochromator - Metrology
Table of Contents
This report is also available as a pdf.
In this document, the metrology system is studied. First, in Section 1 the goal of the metrology system is stated and the proposed concept is described. In order to increase the accuracy of the metrology system, two problems are to be dealt with:
- The deformation of the metrology frame under the action of gravity (Section 2)
- The periodic non-linearity of the interferometers (Section 3)
1. Metrology Concept
The goal of the metrology system is to measure the distance and default of parallelism orientation between the first and second crystals
Only 3 degrees of freedom are of interest:
- \(d_z\)
- \(r_y\)
- \(r_x\)
1.1. Sensor Topology
In order to measure the relative pose of the two crystals, instead of performing a direct measurement which is complicated, the pose of the two crystals are measured from a metrology frame. Three interferometers are used to measured the 3dof of interest for each crystals. Three additional interferometers are used to measured the relative motion of the metrology frame.
| Notation | Meaning |
|---|---|
d |
“Downstream”: Positive X |
u |
“Upstream”: Negative X |
h |
“Hall”: Positive Y |
r |
“Ring”: Negative Y |
f |
“Frame” |
1 |
“First Crystals” |
2 |
“Second Crystals” |
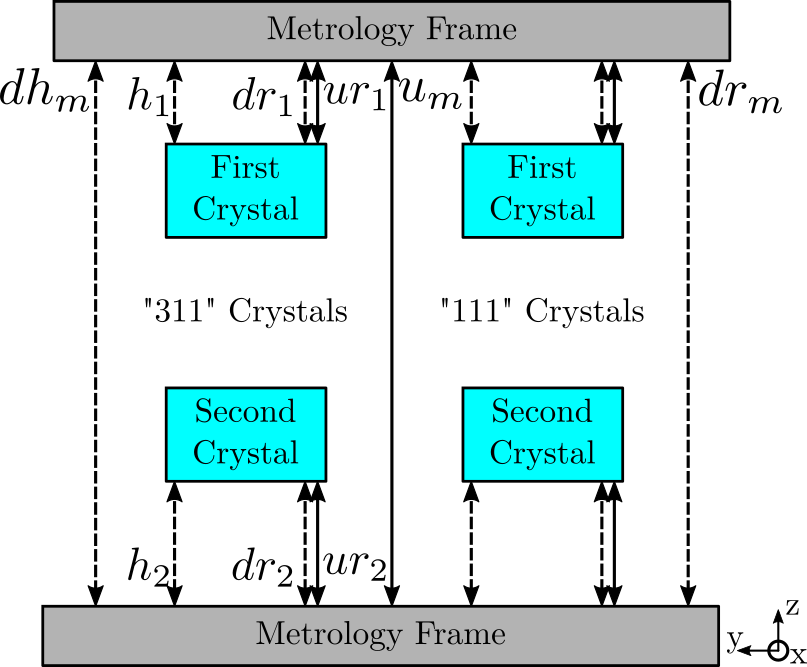
Figure 1: Schematic of the Metrology System
1.2. Crystal’s motion computation
From the raw interferometric measurements, the pose between the first and second crystals can be computed.
First, Jacobian matrices can be used to convert raw interferometer measurements to axial displacement and orientation of the crystals and metrology frame.
For the 311 crystals:
| Notation | Description |
|---|---|
um |
Metrology Frame - Upstream |
dhm |
Metrology Frame - Downstream Hall |
drm |
Metrology Frame - Downstream Ring |
ur1 |
First Crystal - Upstream Ring |
h1 |
First Crystal - Hall |
dr1 |
First Crystal - Downstream Ring |
ur2 |
First Crystal - Upstream Ring |
h2 |
First Crystal - Hall |
dr2 |
First Crystal - Downstream Ring |
| Notation | Description |
|---|---|
dzm |
Positive: increase of distance |
rym |
|
rxm |
|
dz1 |
Positive: decrease of distance |
ry1 |
|
rx1 |
|
dz2 |
Positive: increase of distance |
ry2 |
|
rx2 |
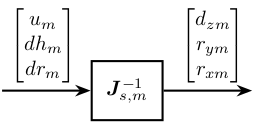
Figure 2: Forward Kinematics for the Metrology frame
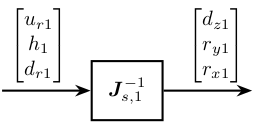
Figure 3: Forward Kinematics for the 1st crystal
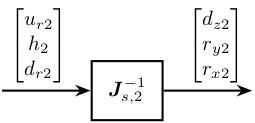
Figure 4: Forward Kinematics for the 2nd crystal
Then, the displacement and orientations can be combined as follows:
\begin{align} d_{z} &= + d_{z1} - d_{z2} + d_{zm} \\ d_{r_y} &= - r_{y1} + r_{y2} - r_{ym} \\ d_{r_x} &= - r_{x1} + r_{x2} - r_{xm} \end{align}Therefore:
- \(d_z\) represents the distance between the two crystals
- \(d_{r_y}\) represents the rotation of the second crystal w.r.t. the first crystal around \(y\) axis
- \(d_{r_x}\) represents the rotation of the second crystal w.r.t. the first crystal around \(x\) axis
If \(d_{r_y}\) is positive, the second crystal has a positive rotation around \(y\) w.r.t. the first crystal. Therefore, the second crystal should be actuated such that it is making a negative rotation around \(y\) w.r.t. metrology frame.
The Jacobian matrices are defined as follow:
%% Sensor Jacobian matrix for the metrology frame
J_m = [1,  0.102,  0
       1, -0.088,  0.1275
       1, -0.088, -0.1275];

%% Sensor Jacobian matrix for 1st "111" crystal
J_s_111_1 = [-1, -0.036, -0.015
             -1,  0,      0.015
             -1,  0.036, -0.015];

%% Sensor Jacobian matrix for 2nd "111" crystal
J_s_111_2 = [1,  0.07,  0.015
             1,  0,    -0.015
             1, -0.07,  0.015];
Therefore, the matrix that gives the relative pose of the crystal from the 9 interferometers is:
%% Compute the transformation matrix
G_111_t = [-inv(J_s_111_1), inv(J_s_111_2), -inv(J_m)];

% Sign convention for the axial motion
G_111_t(1,:) = -G_111_t(1,:);
ur1 [nm] |
h1 [nm] |
dr1 [nm] |
ur2 [nm] |
h2 [nm] |
dr1 [nm] |
um [nm] |
dhm [nm] |
drm [nm] |
|
|---|---|---|---|---|---|---|---|---|---|
dz [nm] |
-0.25 | -0.5 | -0.25 | -0.25 | -0.5 | -0.25 | 0.463 | 0.268 | 0.268 |
rx [nrad] |
13.889 | 0.0 | -13.889 | 7.143 | 0.0 | -7.143 | -5.263 | 2.632 | 2.632 |
ry [nrad] |
16.667 | -33.333 | 16.667 | 16.667 | -33.333 | 16.667 | 0.0 | -3.922 | 3.922 |
From table 4, we can determine the effect of each interferometer on the estimated relative pose between the crystals.
For instance, an error on dr1 will have much greater impact on ry than an error on drm.
2. Deformations of the Metrology Frame
The transformation matrix in Table 4 is valid only if the metrology frames are solid bodies.
The metrology frame itself is experiencing some deformations due to the gravity. When the bragg axis is scanned, the effect of gravity on the metrology frame is changing and this introduce some measurement errors.
This can be calibrated.
2.1. Measurement Setup
Two beam viewers:
- one close to the DCM to measure position of the beam
- one far away to the DCM to measure orientation of the beam
For each Bragg angle, the Fast Jacks are actuated to that the beam is at the center of the beam viewer. Then, then position of the crystals as measured by the interferometers is recorded. This position is the wanted position for a given Bragg angle.
2.2. Simulations
The deformations of the metrology frame and therefore the expected interferometric measurements can be computed as a function of the Bragg angle. This may be done using FE software.
2.3. Comparison
3. Attocube - Periodic Non-Linearity
(Ducourtieux, 2018, p. 11 to 12; See Thurner et al., 2015, p. 8)
The idea is to calibrate the periodic non-linearity of the interferometers, a known displacement must be imposed and the interferometer output compared to this displacement. This should be performed over several periods in order to characterize the error.
We here suppose that we are already in the frame of the Attocube (the fast-jack displacements are converted to Attocube displacement using the transformation matrices). We also suppose that we are at a certain Bragg angle, and that the stepper motors are not moving: only the piezoelectric actuators are used.
The setup is schematically with the block diagram in Figure 5. The signals are:
- \(u\): Actuator Signal (position where we wish to go)
- \(d\): Disturbances affecting the signal
- \(y\): Displacement of the crystal
- \(y_g\): Measurement of the crystal motion by the strain gauge with some noise \(n_g\)
- \(y_a\): Measurement of the crystal motion by the interferometer with some noise \(n_a\)
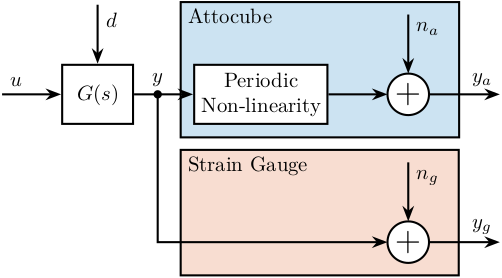
Figure 5: Block Diagram schematic of the setup used to measure the periodic non-linearity of the Attocube
The problem is to estimate the periodic non-linearity of the Attocube from the imperfect measurements \(y_a\) and \(y_g\).
The wavelength of the Attocube is 1530nm, therefore the non-linearity has a period of 765nm. The amplitude of the non-linearity can vary from one unit to the other (and maybe from one experimental condition to the other). It is typically between 5nm peak to peak and 20nm peak to peak.
3.1. Calibration - Concept
3.2. Measurements
We have some constrains on the way the motion is imposed and measured:
- We want the frequency content of the imposed motion to be at low frequency in order not to induce vibrations of the structure. We have to make sure the forces applied by the piezoelectric actuator only moves the crystal and not the fast jack below. Therefore, we have to move much slower than the first resonance frequency in the system.
- As both \(y_a\) and \(y_g\) should have rather small noise, we have to filter them with low pass filters. The cut-off frequency of the low pass filter should be high as compared to the motion (to not induce any distortion) but still reducing sufficiently the noise. Let’s say we want the noise to be less than 1nm (\(6 \sigma\)).
Suppose we have the power spectral density (PSD) of both \(n_a\) and \(n_g\).
[ ]Take the PSD of the Attocube[ ]Take the PSD of the strain gauge[ ]Using 2nd order low pass filter, estimate the required low pass filter cut-off frequency to have sufficiently low noise